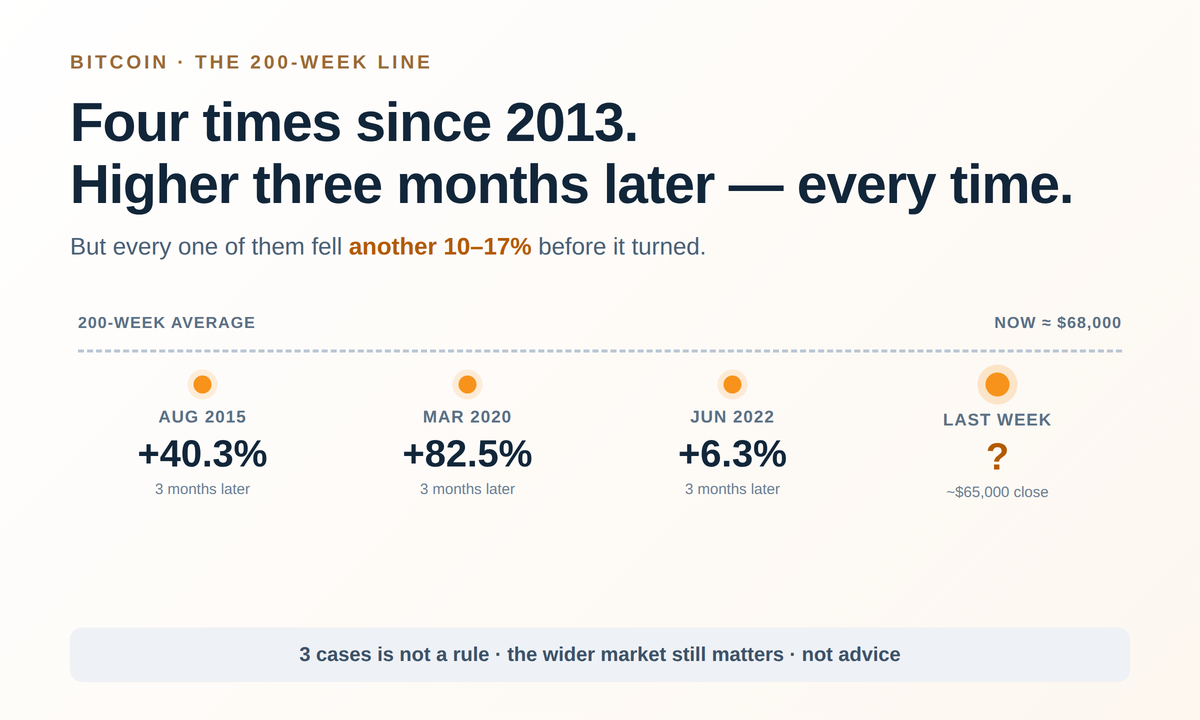
Bitcoin had a rough week — down 12.6% — and in the middle of that drop it slipped below its 200-week moving average. The line sits near $68,000; price closed just above $65,000.
Short version: this exact setup has happened three times before since 2013, and price was higher three months later every time — but not before falling another 10–17% first.
 What the line actually is
For anyone who doesn’t follow charts closely: it’s just the average weekly closing price over the last 200 weeks, roughly four years. Traders watch it because it smooths out all the short-term noise and gives a rough sense of the longer-term trend. Above it has usually been read as the long-term trend still pointing up, and falling below gets attention because it doesn’t happen very often.
One detail worth keeping in mind: the average itself is near $68,000 and still climbing. This is a moving line, not a fixed floor.
 The three times before
CoinDesk looked back at every week since 2013 — when the average first became available — that had both a drop of 12% or more and a close below the average. Including last week, that is four times. Here are the three before this one:
| When | Three months later | But first |
|---|---|---|
| Aug 2015 | +40.3% | another dip |
| Mar 2020 (covid crash) | +82.5% | another dip |
| Jun 2022 | +6.3% | another dip |
The 2022 one needs the footnote most summaries skip: that +6.3% didn’t hold. FTX collapsed in November 2022 and bitcoin went to about $15,500. “Higher three months later” is true — and it still wasn’t the end of the pain.
 The catch in the numbers
In each of those three earlier cases, the rebound did not come right away. Bitcoin first fell another 10–17% before turning higher. From last week’s close, that would put it around $54,000–$59,000 — the same range some analysts are warning about now.
That is the part the “bullish track record” headlines leave out. The good history and the rough next few weeks can both be true at once.
 What it doesn’t tell you
- Three cases don’t make a rule, and each of those times had its own market conditions. CoinDesk says as much too.
- Wider conditions still matter. Persistent ETF outflows and rising bond yields could keep prices under pressure for longer than three months.
- Big weekly drops on their own are nothing new — 77 weeks with losses of 12% or more since 2009. It’s the combination with a break of this average that’s rare, and even that has only happened four times.
- The one read that holds up: these crashes sat near the end of bear markets, not the start or the middle. That’s an observation, not a prediction.
 My take
So I’m not taking it as a signal on its own, just as something worth keeping an eye on along with everything else going on.
What do you lot make of it — do you actually pay attention to the 200-week average when you’re thinking about Bitcoin, or is it just another line on a chart that gets talked up after a big red week?
 !