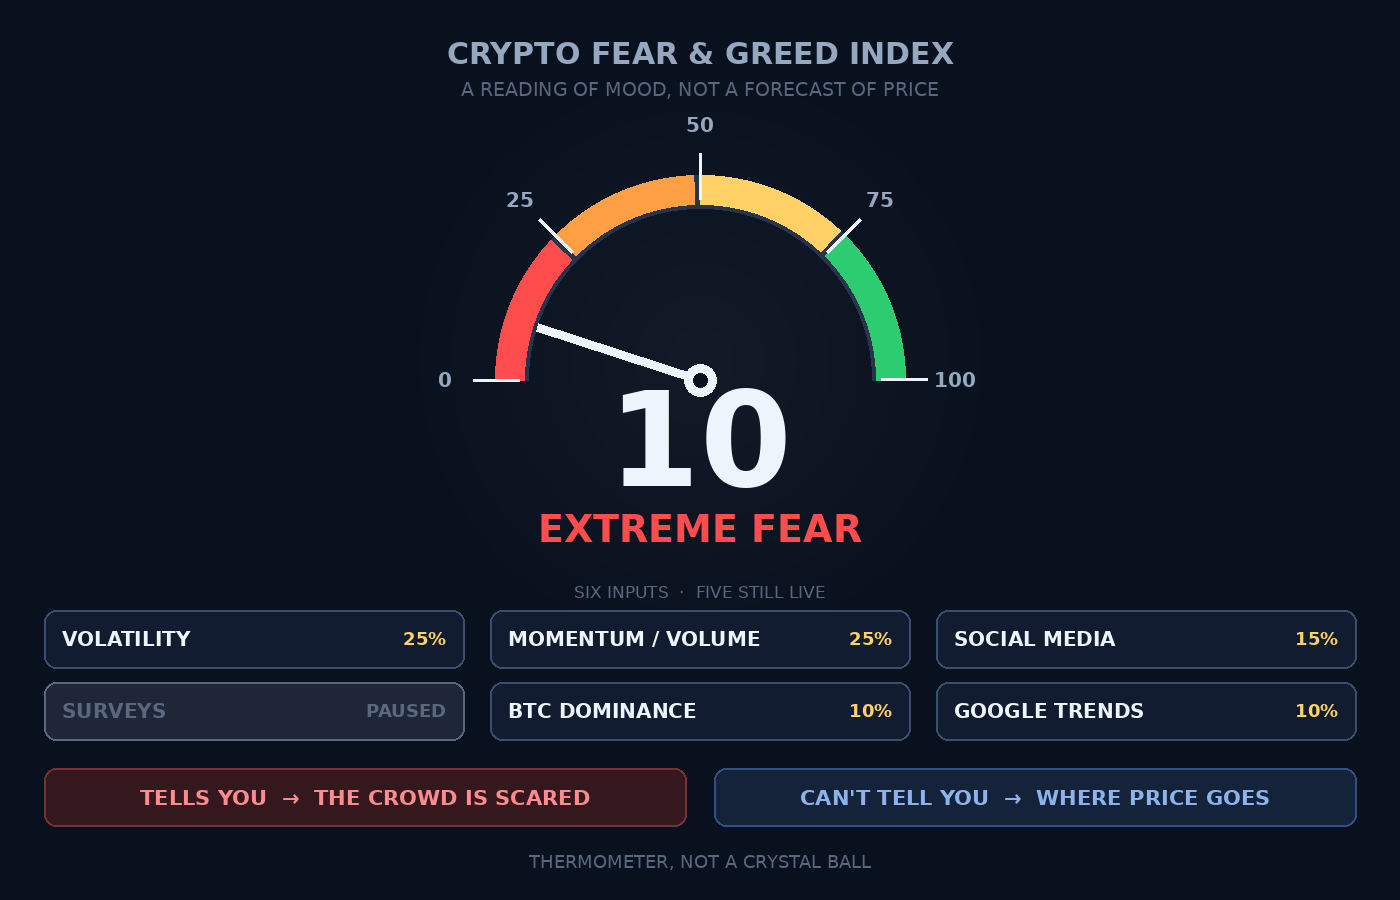
The Crypto Fear & Greed Index just printed 10. Bitcoin is near $63,900, down about 12% on the week and under its 200-week average for the first time in a while. The question everywhere is the same: is this the bottom?
Short answer: the gauge reads mood, not price. Here’s what it’s built from, what it has meant before, and what’s actually moving money while everyone stares at the dial.
1. What the number is 
A daily 0–100 score. 0 is extreme fear, 100 is extreme greed. Six inputs feed it — volatility, momentum and volume, social media, surveys, Bitcoin dominance and Google trends — each compared with its own recent average.
2. The detail almost everyone misses 
Surveys have been paused since 2024. So five inputs do the work today, and the “six signals” line you’ll see everywhere is out of date.
3. Why 10 raises eyebrows 
10 sits deep in the 0–24 extreme-fear band. It rarely gets this low — it touched 8 in May 2022, the second-lowest reading on record.
4. What it is not 
A thermometer, not a crystal ball. It says the crowd is scared; it does not put a floor under price. Fear can sit at 10 for weeks while price keeps sliding.
5. “Buy the fear”? Tested 
Here’s the surprising part. After extreme-fear episodes, Bitcoin’s average 90-day return was +13.2% — below the +26.4% average of all days. Hitting exactly 10 since 2018? Median 3-month return was −3.0%. Extreme fear is a mood reading, not a buy signal.
6. What’s actually moving price 
Spot Bitcoin ETFs bled $239.9M on Tuesday, right after Monday’s inflow broke a 7-day outflow streak. Flows beat feelings.
7. Institutions repricing, not panicking 
Citi cut its 12-month Bitcoin target to $99,532 from $113,000, and ETH to $2,838. A target cut is a math update, not a fire sale.
8. The 200-week line, honestly 
Bitcoin is below its 200-week moving average — only three similar cases since 2013. Three is a handful, not a rule.
9. Not everything is bleeding 
Zcash is up about 3.4% and Solana is holding near $75. “The market is scared” is not the same as “everything is dead.”
10. What to actually do 
Don’t let one number decide for you. Watch flows, watch liquidity, and follow a plan you wrote before the red week — not one you write during it.
Check the gauge yourself — the 60-second routine
- Open the live gauge and read today’s number, not a screenshot from a post.
- Ask: mood or money? Check ETF flows, stablecoin liquidity and volume.
- Look at the last time it was this low — then check what price did 90 days later. The myth is bigger than the data.
- Decide with a plan you wrote calmly, not a reaction you write scared.
Check it yourself 
Live gauge → alternative.me
Methodology in plain English → Kraken
Extreme-fear data since 2013 → fastbitcoin.app
Every reading at 10 since 2018 → coinjuice.com
When the index touched 8 → K33
The gauge is useful. It just isn’t a map.
 !